
Statistics Resources
Warning: A non-numeric value encountered in /home/smchigho/public_html/resources/wp-content/themes/AegaeusWP/includes/theme-likes.php on line 72
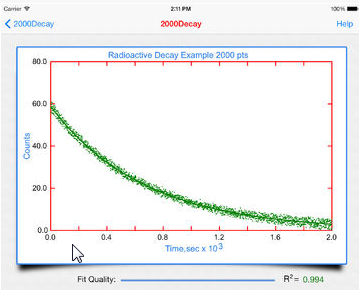
App – DataAnalysis
DataAnalysis Developer: Data Evaluation Systems Free Available for iPad only Thanks to John Forte for suggesting this app This app plots and analyses any data that can be formulated as x, y pairs. Data points are entered directly into the […]Warning: A non-numeric value encountered in /home/smchigho/public_html/resources/wp-content/themes/AegaeusWP/includes/theme-likes.php on line 72
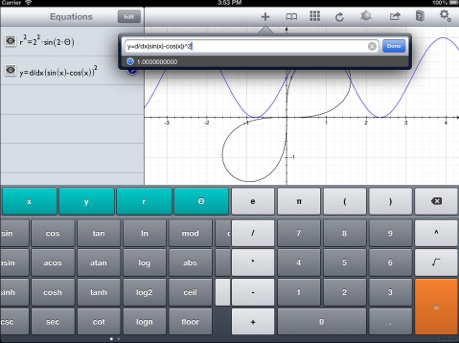
App – Quick Graph
Developer: Colombiamug $1.99 Available for iPad and iPhone Quick Graph is a mathematical expression graphing tool for plotting both 2D and 3D equations. It allows plotting of multiple equations on the same graph, color codes them for easy identification, and […]Warning: A non-numeric value encountered in /home/smchigho/public_html/resources/wp-content/themes/AegaeusWP/includes/theme-likes.php on line 72
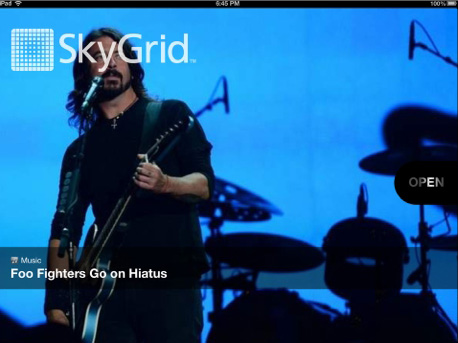
App – SkyGrid
Developer: SkyGrid Free Available for iPad and iPhone SkyGrid delivers to your iPad or iPhone the latest news from 100s of sources in sports, business, science and technology, health, travel, art and design, and many others. The opening page of […]Warning: A non-numeric value encountered in /home/smchigho/public_html/resources/wp-content/themes/AegaeusWP/includes/theme-likes.php on line 72
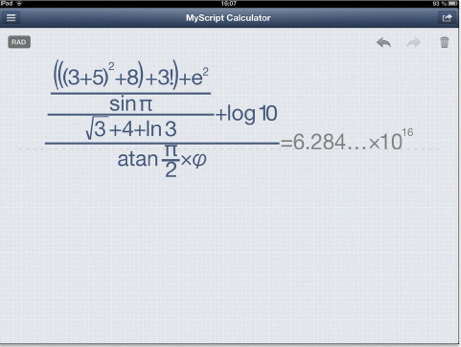
App – MyScript Calculator – Handwriting calculator
Developer: Vision Objects Free App Available for iPad & iPhone This is truly an amazing app that does more than just hint at what the future of handheld computing has in store. With your finger or a stylus, write any […]Warning: A non-numeric value encountered in /home/smchigho/public_html/resources/wp-content/themes/AegaeusWP/includes/theme-likes.php on line 72
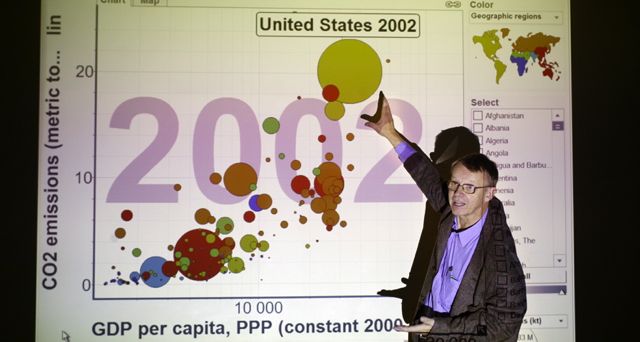
Gapminder – A Fact-Based Worldview
Gapminder uses animated and interactive data-visualisation to display statistical data on a wide range of topics. There are some 500 data sets that can be plotted in categories like economics, education, energy, environment, health, infrastructure, population, societal, and work, encompassing […]Site Visitors Map
